Category: Visualisation
-
Visualising Population | Australian Interstate Migration Figures
I’m a migrant, and migration data has always fascinated me. While the media focus is often on international migration to Australia, the COVID pandemic suddenly threw interstate migration into sharp focus, as lockdowns in various states may have incentivised different people to question where they lived and what type of life they wanted to live. And as…
-
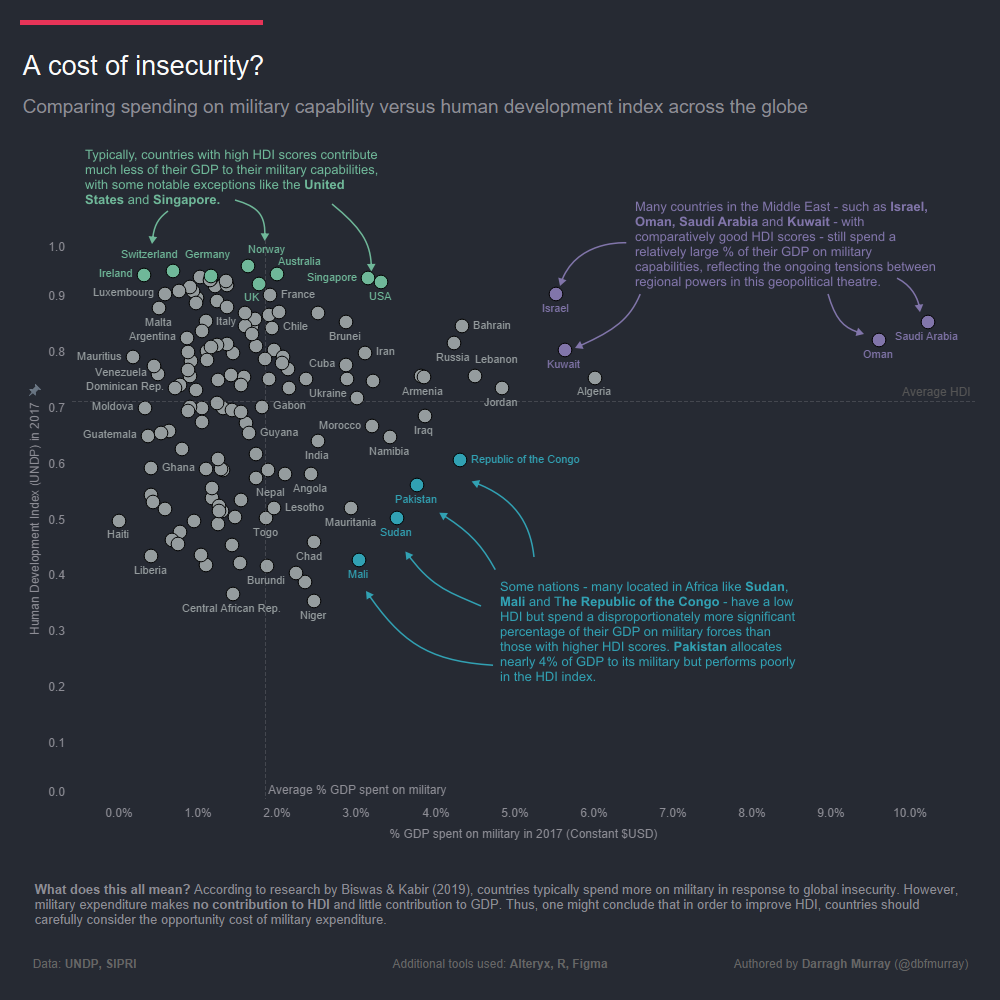
A Cost of Insecurity – Comparing Spending on Military Capability v the Human Development Index
One great thing about the company I work for is that they continually encourage us to develop our skills via monthly data visualisation challenges. The latest challenge was themed on ‘scatter plots’ and it was definitely one I wished to be a part of – I love scatter plots! Harking back to my postgraduate studies…
-
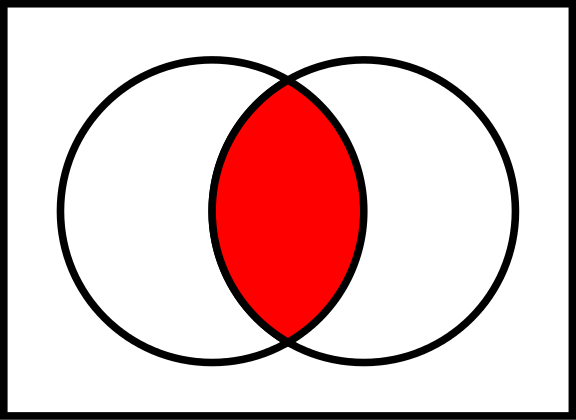
Fun with sets: Highlighting/filtering data using a shared attribute of a selected value in Tableau
Have you ever wanted to be able to filter or highlight records in a Tableau visualisation that share a common attribute? For example, say you had a visualisation and a filter that listed animals. You select ‘kangaroo’, and the visualisation would filter for ‘kangaroo’ and all other marsupials – animals that share the same infraclass…
-
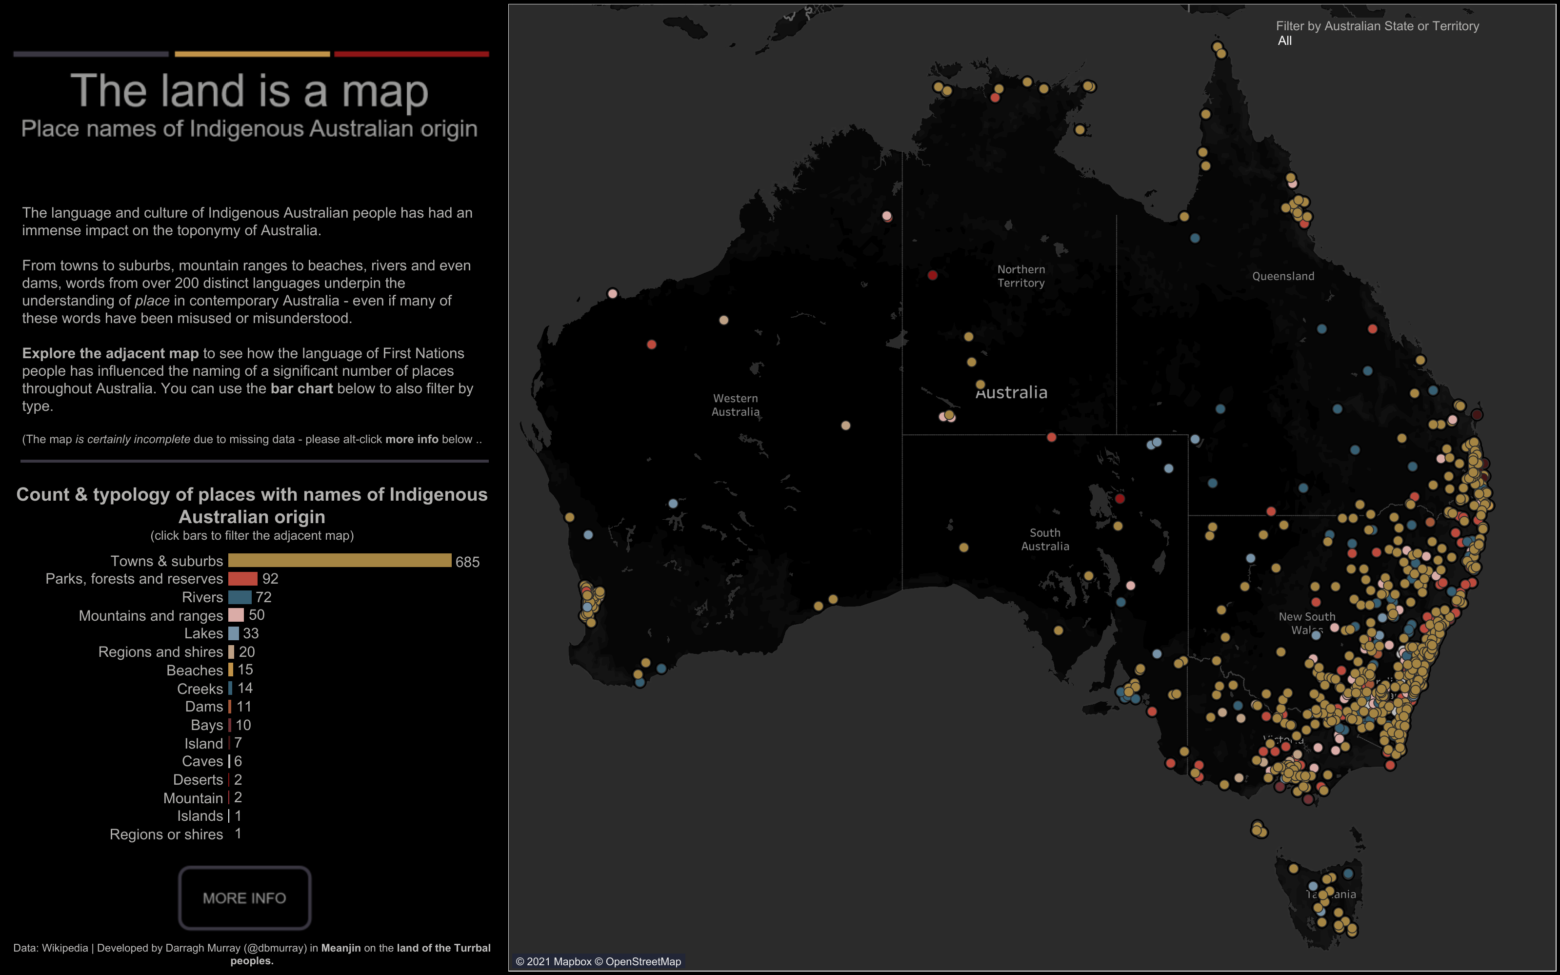
The Land is a Map: On being awarded Viz of the Day
Last week I was fortunate enough to be awarded my first ever ‘Viz of the Day’ (or VOTD). The more expansive (and I think better version) of the visualisation can be found on my Tableau Public profile. If you don’t have a clue about what I’m talking about, Tableau – the purveyor of fine data…
-
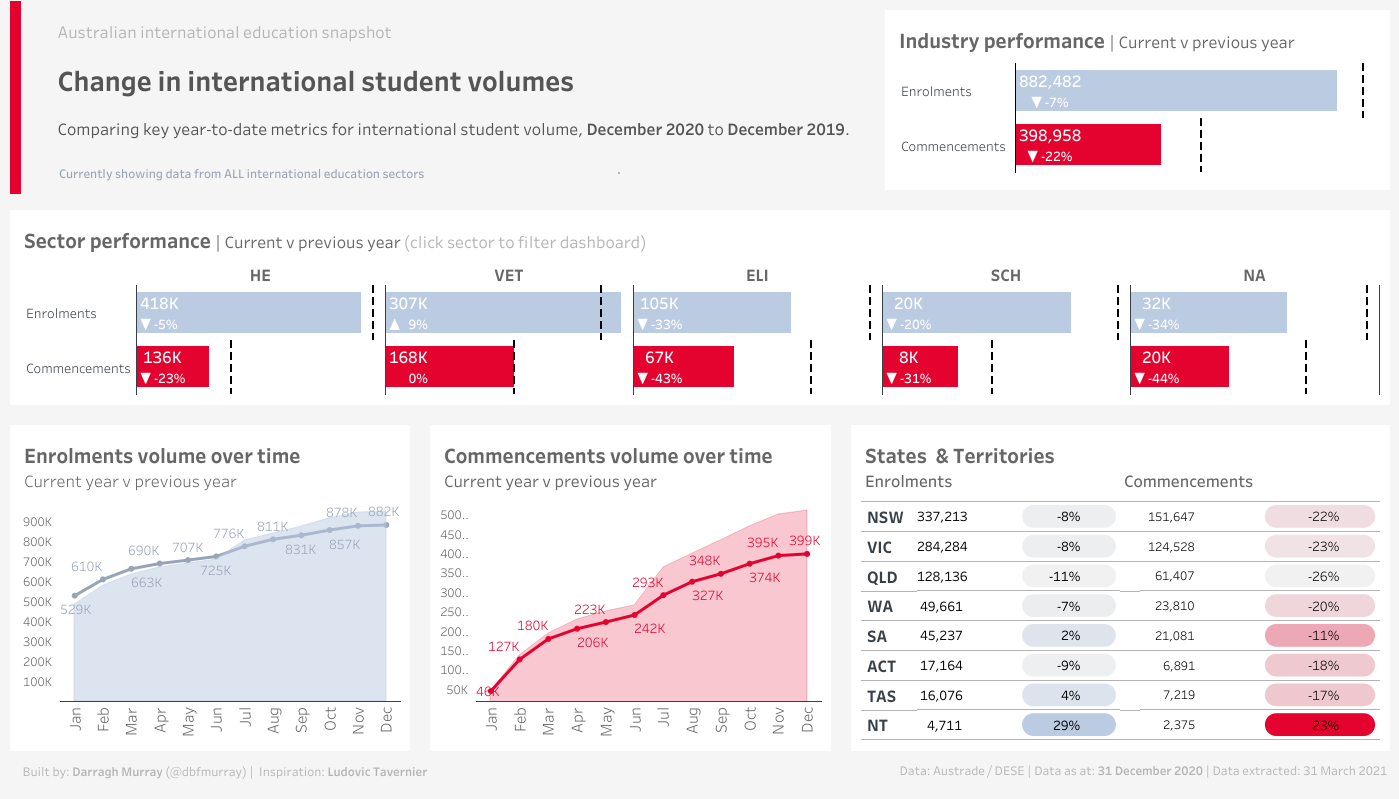
An updated Australian international education snapshot dashboard
I finally got around to updating my Australian international education snapshot dashboard. The original one, while I think was somewhat novel at the time, suffered from a fair few design flaws. Also, it didn’t render very well on Tableau Public. Since I originally did that viz, I’ve come quite some way in my Tableau abilities.…
-
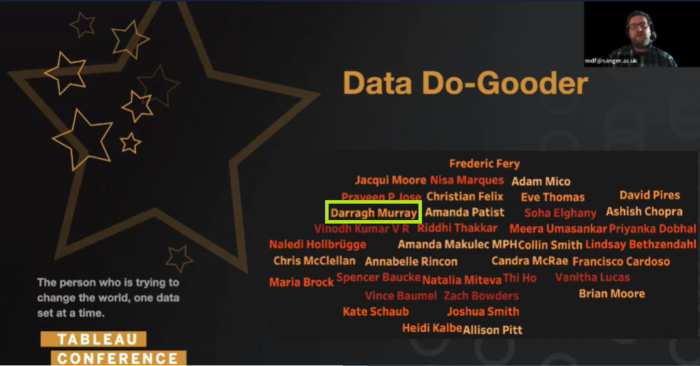
Nominated for a 2020 Vizzie Award
I choose a poor week to go on holidays and my time off coincided with the annual Tableau conference which this year was held virtually. I didn’t bring any technology with me during my holiday and thus found it difficult to tune in to what looked like a great series of talks and presentations. On…
