
I finally got around to updating my Australian international education snapshot dashboard. The original one, while I think was somewhat novel at the time, suffered from a fair few design flaws. Also, it didn’t render very well on Tableau Public.
Since I originally did that viz, I’ve come quite some way in my Tableau abilities. This dashboard came out of reading some of the thoughts of Robert Janezic, specifically his post “Modern Dashboard Design”, which is well worth a read.
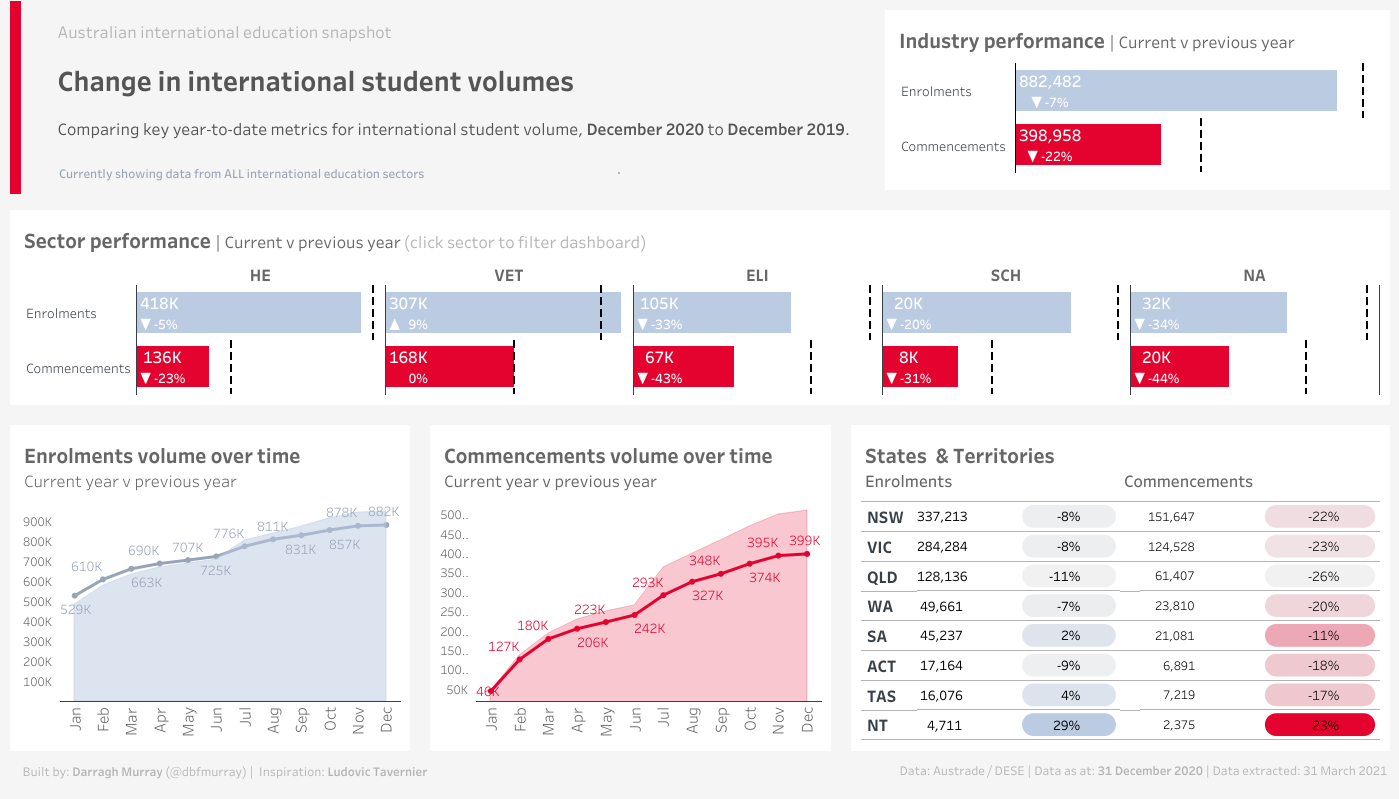
In that post, he links to a great looking dashboard by Ludovic Tavernier. I ended up borrowing a few concepts from Ludovic, in particular the really cool looking table with these ‘pill’ like highlights. So in some ways, this dashboard has elements of tribute to Ludovic.
This uses a publically available dataset made available by Austrade. Data was transformed using my new favourite language, R (specifically TidyVerse). Then everything else done in Tableau Public.
I appreciate that many of the elements adn terms used on the dashboard will only really make sense to those who work in Australian international education. I’ll be putting in some extra features in due course (such as source country data) as well as a glossary that helps those who don’t work in the industry understand it all.
You can see the updated visualisation via my Tableau Public profile.
Leave a Reply
You must be logged in to post a comment.