
The Department of Education, Skills and Employment provide the international education sector in Australia with a large amount of very useful data on international students studying within our borders. Much of it is provided in a number of formats – from pivot tables made available through Austrade’s Market Information Package to a range of data visualisations on the Department’s website itself.
Being a data visualisation aficionado and and analytics working in this field for nearly nine years now, I have used these resources heavily. However, one area that I had not particularly visited often was the Department’s international student data at a sub-State level, where they break down international student numbers by local government area (LGA).
The interface looks like the following:
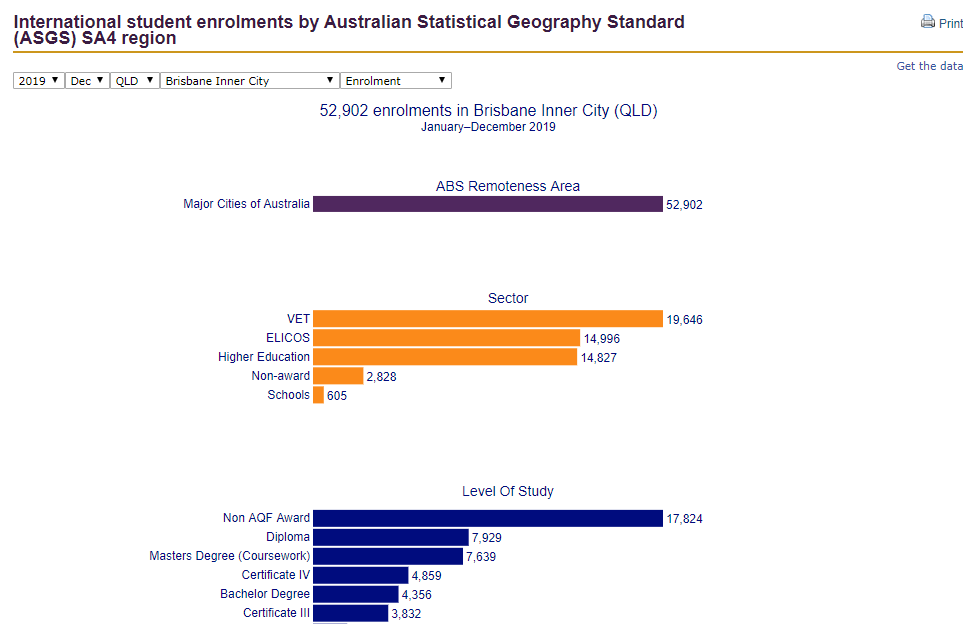
Now while this interface is all well and good if you want to examine regions one by one, it’s not super handy if you want to compare across regions at the same time. Fortunately, I spied a handy “Get the data” link in the top right.
I happened to have a Saturday where I had hours to kill, so I decided to see if I could teach myself a bit more about Tableau’s great mapping capability and breathe further life into the great regional data made available by the Department. The resulting basic data visualisation is embedded below.
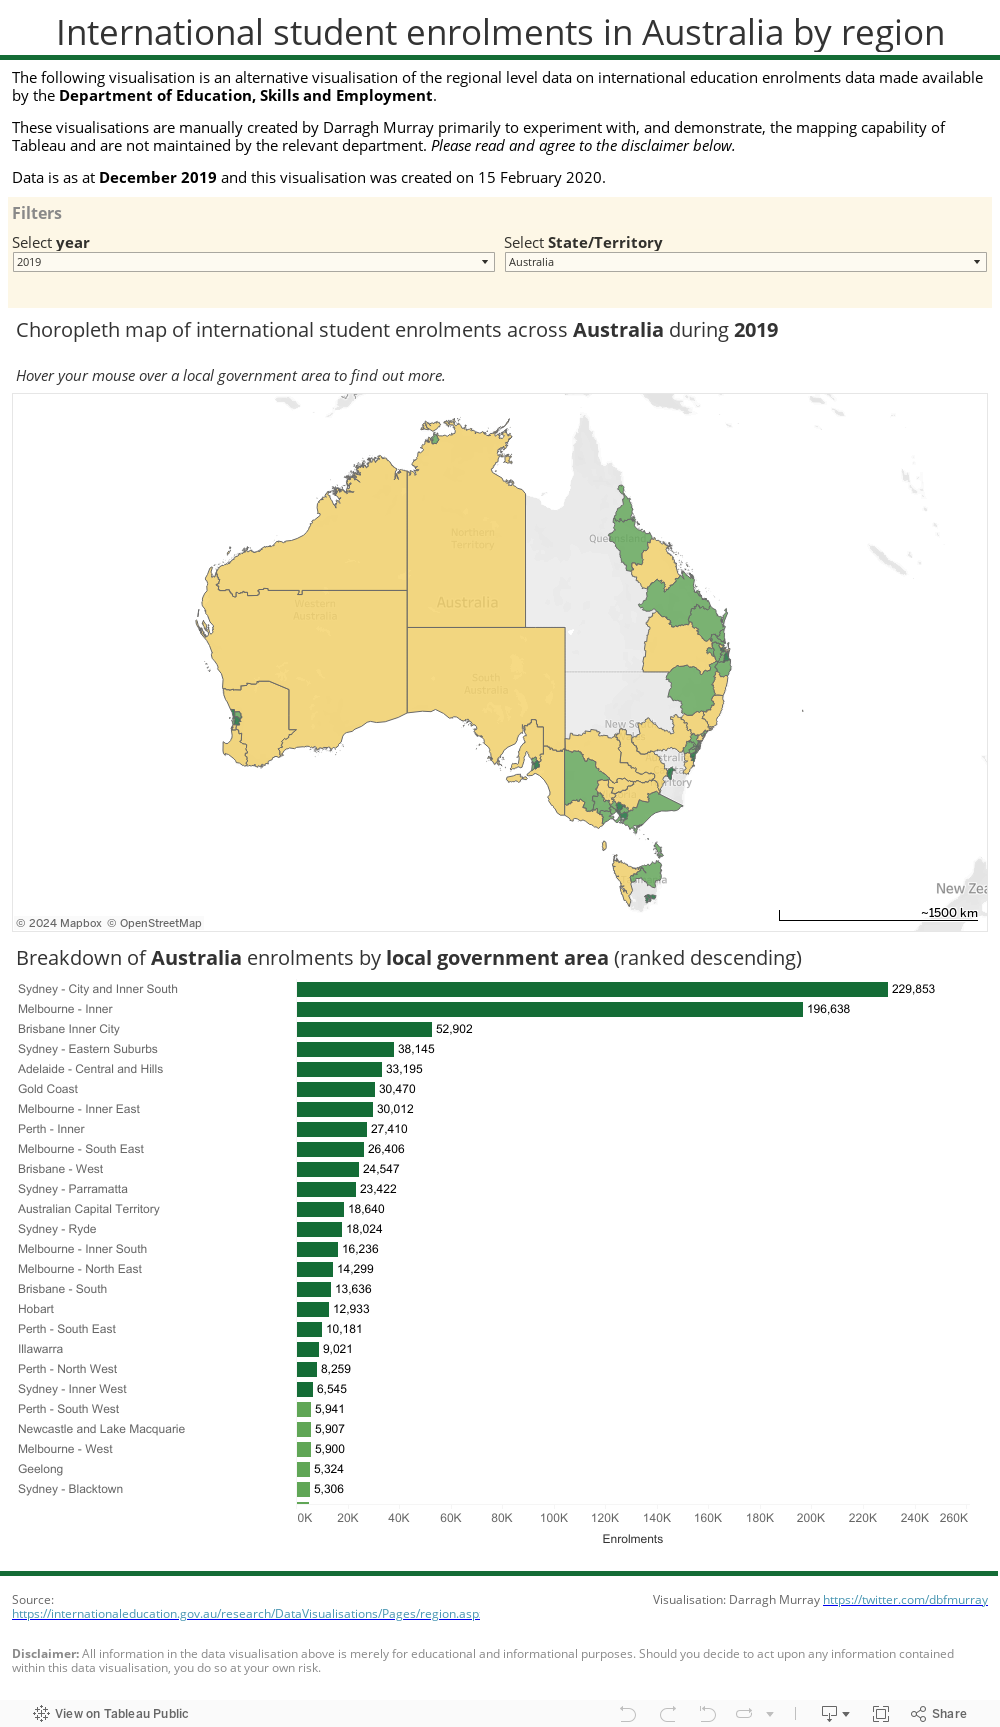
Visually-wise, the above is nothing super special, but I like to think its a bit more accessible than the original data and makes it a bit more useful for the intended audience. I’ve already thought of about a million ways I can make this better (e.g dot density maps!) and if I get time, I’ll look to improve upon it.
You’ll note that the maps seemed to indicate concentration in certain LGAs. This is probably to be expected, because I believe enrolments will reflect the location of education institutions rather than individual students. I haven’t checked every metric, but the few I have checked seem to reflect the data available on the Department’s website.
Furthermore, I’ll be back soon with some information on the steps I went through to wrangle the data into the correct shape to build this visualisation along with the information on the geographical shapes file. Also there’s a few more advancements I can easily make in terms of filters and also the visualisation itself. So stay tuned.
Leave a Reply
You must be logged in to post a comment.