
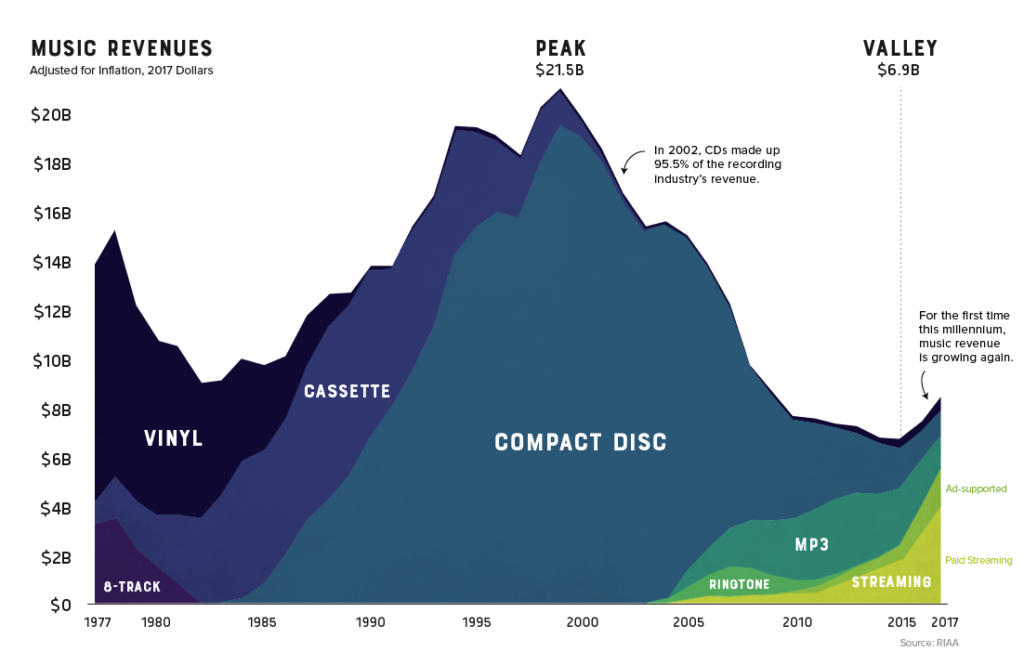
I’m back in the #MakeoverMonday fold after a break for a number of months. Being a former music journalist I felt obligated to participate in this week’s challenge which involved 40 years of data on US music sales by format. Here’s the original visualisation from an article by Nick Routley.
While the original visualisation was actually quite good and informative, I did give myself an hour or two to have a play in Tableau Public as well as the open-source GNU Image Manipulation Program (with the problematic acronym) where I had a go at designing a custom logo based off the instructions in this awesome Youtube tutorial by LogosByNick. I hope someone gets the cheeky reference!
I saw a heap of great visualisations floating around on twitter, but many did look the similar. I tried a slightly different and simple approach and focused in on the total historical amount of revenues generated by each format in the datasets. While the compact disc sales have fallen over the last year, the revenues the industry has generated from this format haven’t been surpassed (yet) by any other rival format.
I was also keen on a pretty neat and small design, so here’s the result of about an hour and a bit of work (spent mostly on the Christian Bale logo, to be honest!). Click on the image below to access the Tableau Public version. 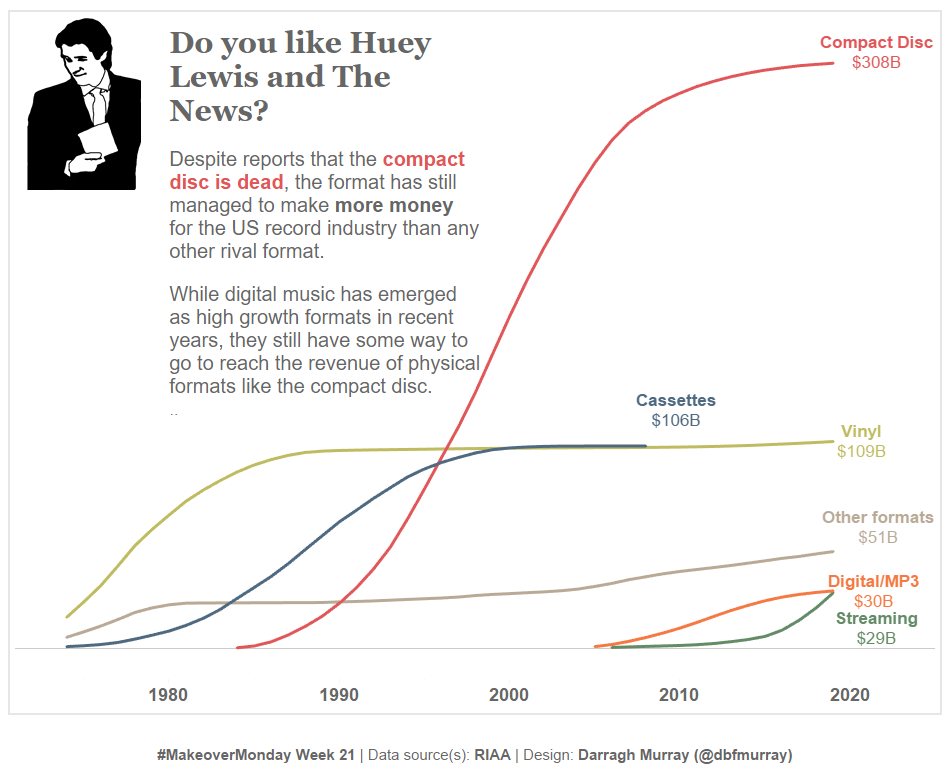
Leave a Reply
You must be logged in to post a comment.