
I was a late submission to the latest #VizForSocialGood round but I did manage to finish off a visualisation that made extensive use of an interactive network diagram.
I’ll be writing much more about how I did this in the near future and will update this post. Want to give a quick shout out to this very helpful tutorial by Christopher Conn of The Data Surfers which this visualisation shares heritage with.
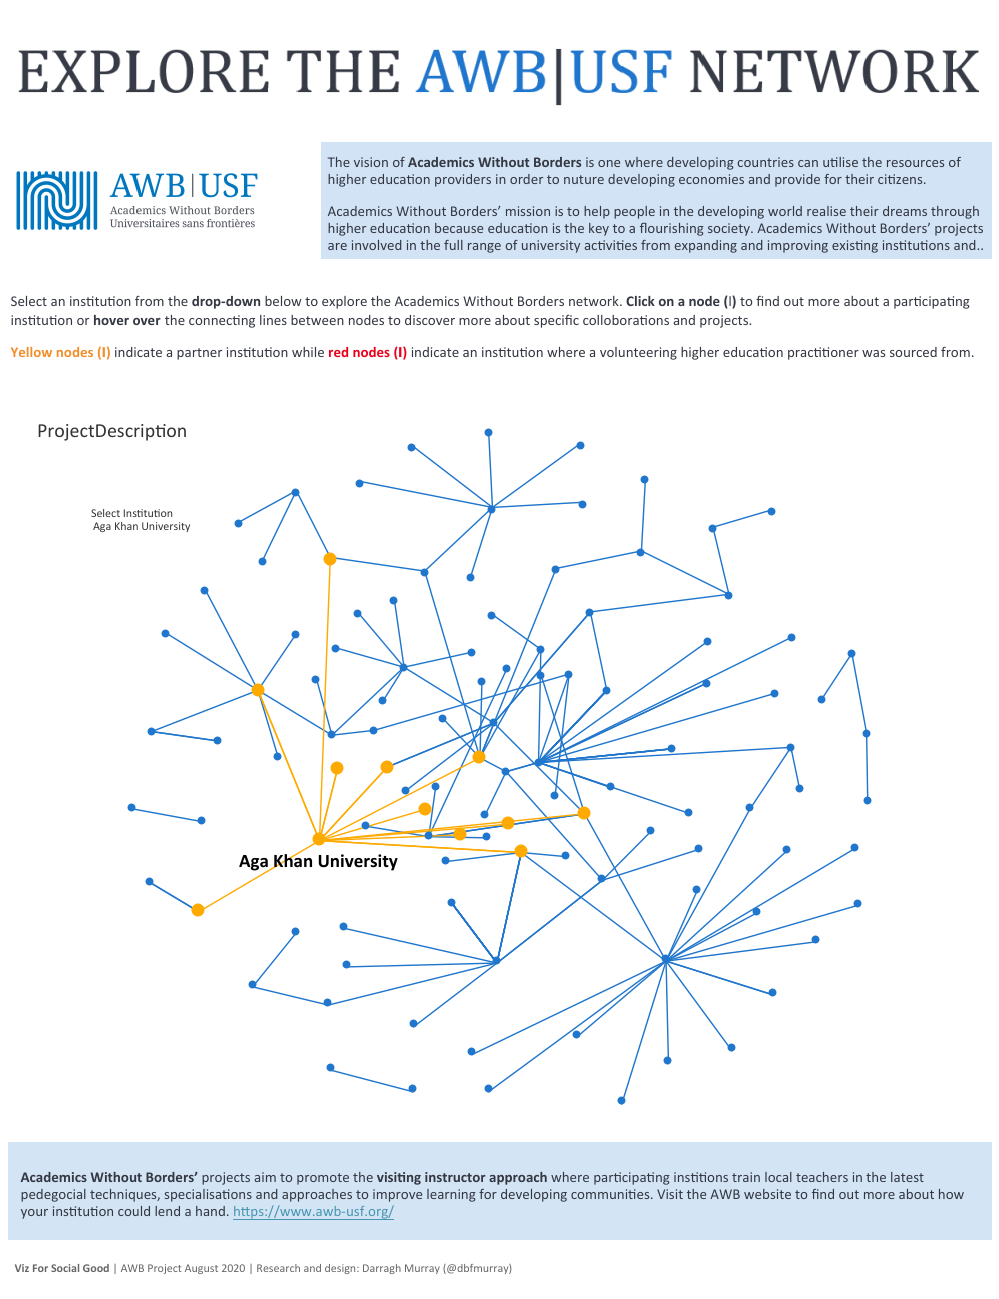
Click on the image below to link through to the viz on Tableau Public!
Leave a Reply
You must be logged in to post a comment.