
Tag: LODs
-
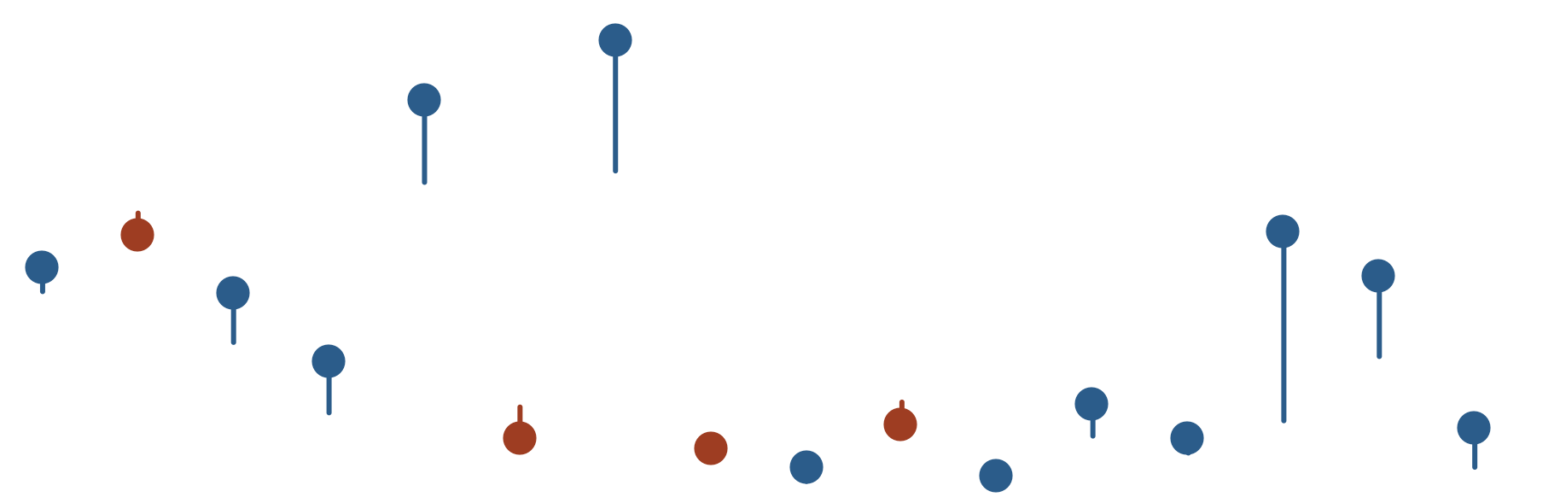
Tadpole Charts with Nicely Placed Labels in Tableau
I’m indifferent to amphibians, but I do like tadpole charts. In this blog, I’m going to show you the steps to create one with a little trick around labelling that may be useful in making this chart – but also for other charts in Tableau. Table of Contents This ones a bit involved, so here’s…