

Filters are great and all, but I genuinely love Tableau parameters.
One technique that I frequently use for certain dashboard designs is using a parameter as the
primary method of interaction. That is, I use parameters to take input from users, which primarily drives the data viewed on screen. The parameter filters worksheets and shows related information about that input, acting much like a database record selection action or a filter in an Excel spreadsheet column.
For example, say you have a dashboard filled with customer activity for a large retailer. The dashboard might show overall sales per customer, customer profits, ranking of customers by sales, and so forth. However, you’re keen to see how data visualisation for all this customer data for a particular product. Both Tableau quick filters and parameters can help achieve this outcome.
In the next section, I’ll show you how to set up your worksheets to filter your data through a parameter. Later I’ll discuss why you choose this option over a filter in the final section.
I will use Tableau’s famous default dataset, Superstore, to assist in this demonstration.
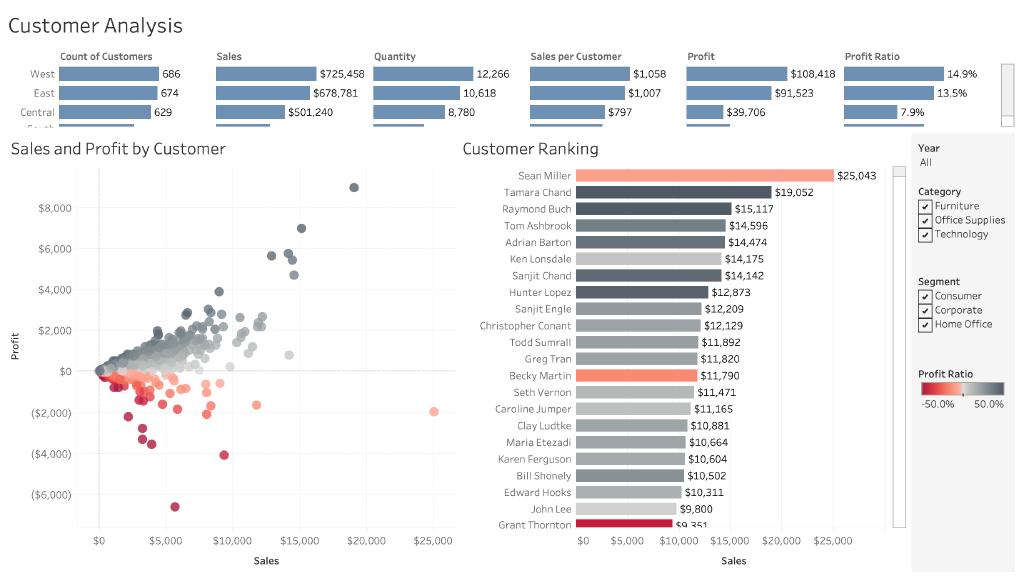
Customer Analysis by Product in Superstore.
Open up your version of Tableau and load up the default Superstore sample workbook.
Locate the Customers dashboard. It should look like Figure 1 below. Duplicate this dashboard and rename it Customer Analysis by Specific Product.
Next, open one of the worksheets on the newly created duplicate dashboard. I suggest the worksheet called CustomerRank
.
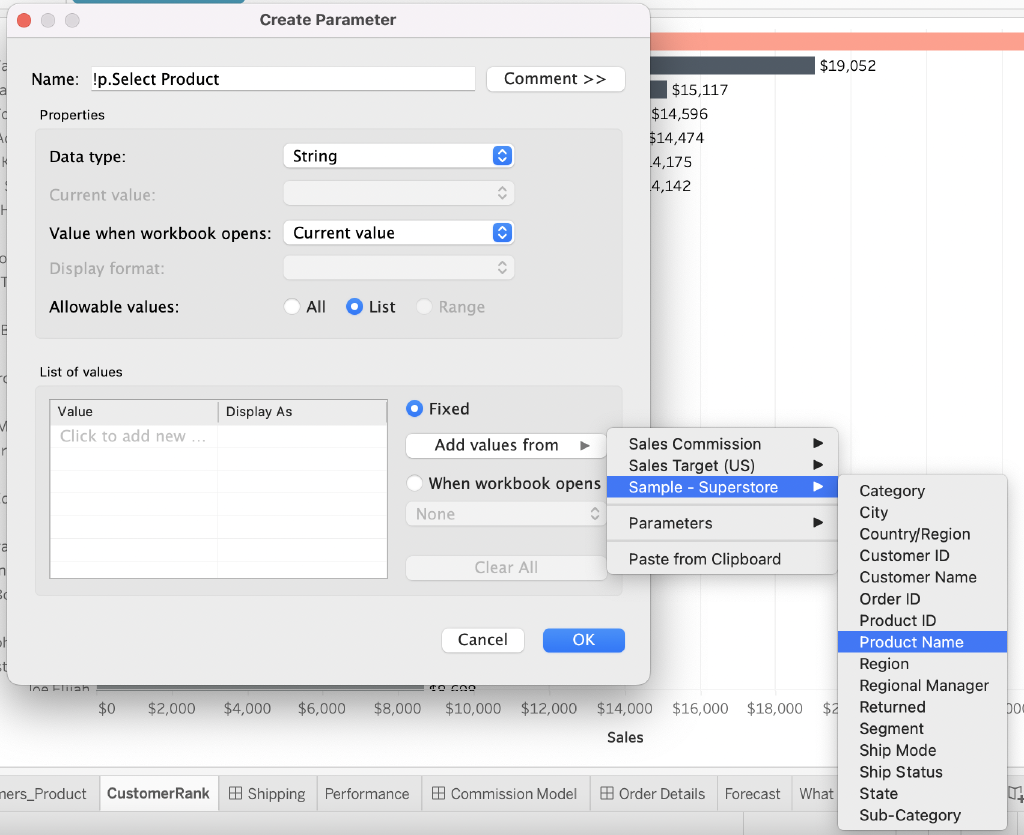
Create a Product List Parameter
Our first job is to create a parameter that lists all available products in the dataset. Do this by creating a string parameter; allowable values should be set to a list, and the list of values should be sourced from the Product Name field within the Sample – Superstore
dataset. Figure 2 below indicates the ideal parameter set-up. You can call this parameter whatever you want, but I have labelled it !p.Select Product
Create a Calculated Field That Determines Product Match
The next step is to match the user input (i.e. the chosen parameter value) to the products available in the underlying data. We do this through a calculated field – specifically an IF..THEN..ELSE that returns TRUE if the parameter value matches the list of available products and FALSE if there is no match.
!c.Match Selected Product
// Match the Product selected in the parameter to the list of products in the dataset.
// Calculation will return TRUE on product match,
if [!p.Select Product] = [Product Name] then TRUE else FALSE end

Now that we have the calculated field, we can use this to filter any worksheet. I have called this field !c.Match Selected Product as you can see above.
Filtering Worksheets By Product
To filter the worksheets correctly, you want to show only data when the previously created calculated field returns TRUE. Hopefully, you’re still on the
CustomerRank worksheet; we’ll use this to continue our build.
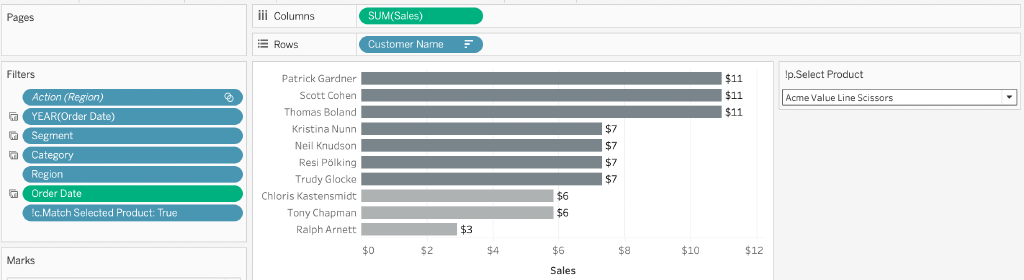
Firstly, locate the parameter !p.Select Product in the data panel right-click and select ‘Add to Sheet’.
In the Parameter input, which hopefully is now showing somewhere in the visualisation pane, select ‘Acme Value Line Scissors’. Nothing of note will happen because we haven’t set up the filtering action yet!
Next, drag your newly calculated field (!c.Match Selected Product) to the Filters shelf and select TRUE from the filter list.

You should see the CustomerRank sheet immediately react, with the customer rank list filtering down to around ten or so customers. This sheet now shows a rank of top customers who have purchased the ‘Acme Value Line Scissors’
.
If you wish, you can play around with your previously created parameter to see how the parameter changes the items in this list.
Repeat for all other relevant worksheets
The process outlined in the previous section can now just be repeated for all relevant worksheets in your workbook that you wish the parameter to filter.
Open up the worksheet, drag the !c.Match Selected Product calculated field to the Filters Shelf and select the filter to be equal TRUE.
These sheets will filter all their data based on whatever you select in the parameter. In Figure 6 below, I’ve gone through all the sheets in the newly created Customer Analysis by Specific Product dashboard (three of them) and applied the filter. They now all show customer data specific to the product selected in our parameter.

Final touches
Two final little touches are relevant to this newly created parameter driven dashboard.
Firstly, we want to give the user the ability to change the parameter value direct from the dashboard itself.
There are a few ways to do this. I like clicking on one of the worksheet containers on your dashboard. Go to the more options context menu, locate the parameter option, and select the
parameter you created earlier.
Your parameter input will appear somewhere in the dashboard. Locate and format it to your likely (don’t forget your padding) and change its title to something more readable like ‘Select Product’.

Secondly, it’s helpful to update the dashboard title to show that the current view is being filtered. Edit the title of your dashboard and locate the insert dropdown. In the subsequent list, find your parameter and insert it into the title. I’ve chosen to update the title to
‘Customer Analysis | Those customers who purchased <Parameters.!p.Select Product>’

Voila! You’ve now got a dashboard that filters all its contents based on a parameter! Essentially in the use case outlined above you’re allowing the user to select a specific record/dimension (e.g. a product) and using that to filter an enitre dashboard.
If you wish to view or download this example, you can do by clicking the link to the dashboard on Tableau Public below
Why choose this approach?
Now, you might think, ‘Why would I use this functionality, particularly when regular filters could achieve the same outcomes?’
In the example I’ve outlined before, simple quick filters will undoubtedly achieve the same outcome using one data source. However, if you’ve got a Tableau workbook with different and disparate data sources, you’ll quickly run into issues using quick filters. This worthwhile read from Robert Curtis at Interworks outlines why: filters are data source specific, i.e. if you’ve got multiple sources of data, quick filters will not work across these data sources. However, as demonstrated in the example above, you can achieve a similar filtering action across data sources using parameters and calculated fields.
I hope you enjoyed this small tutorial and if you have any questions, comments, criticisms please reach out to me. You can always catch me on Twitter at @dbfmurray
Leave a Reply
You must be logged in to post a comment.