
Tag: parameters
-
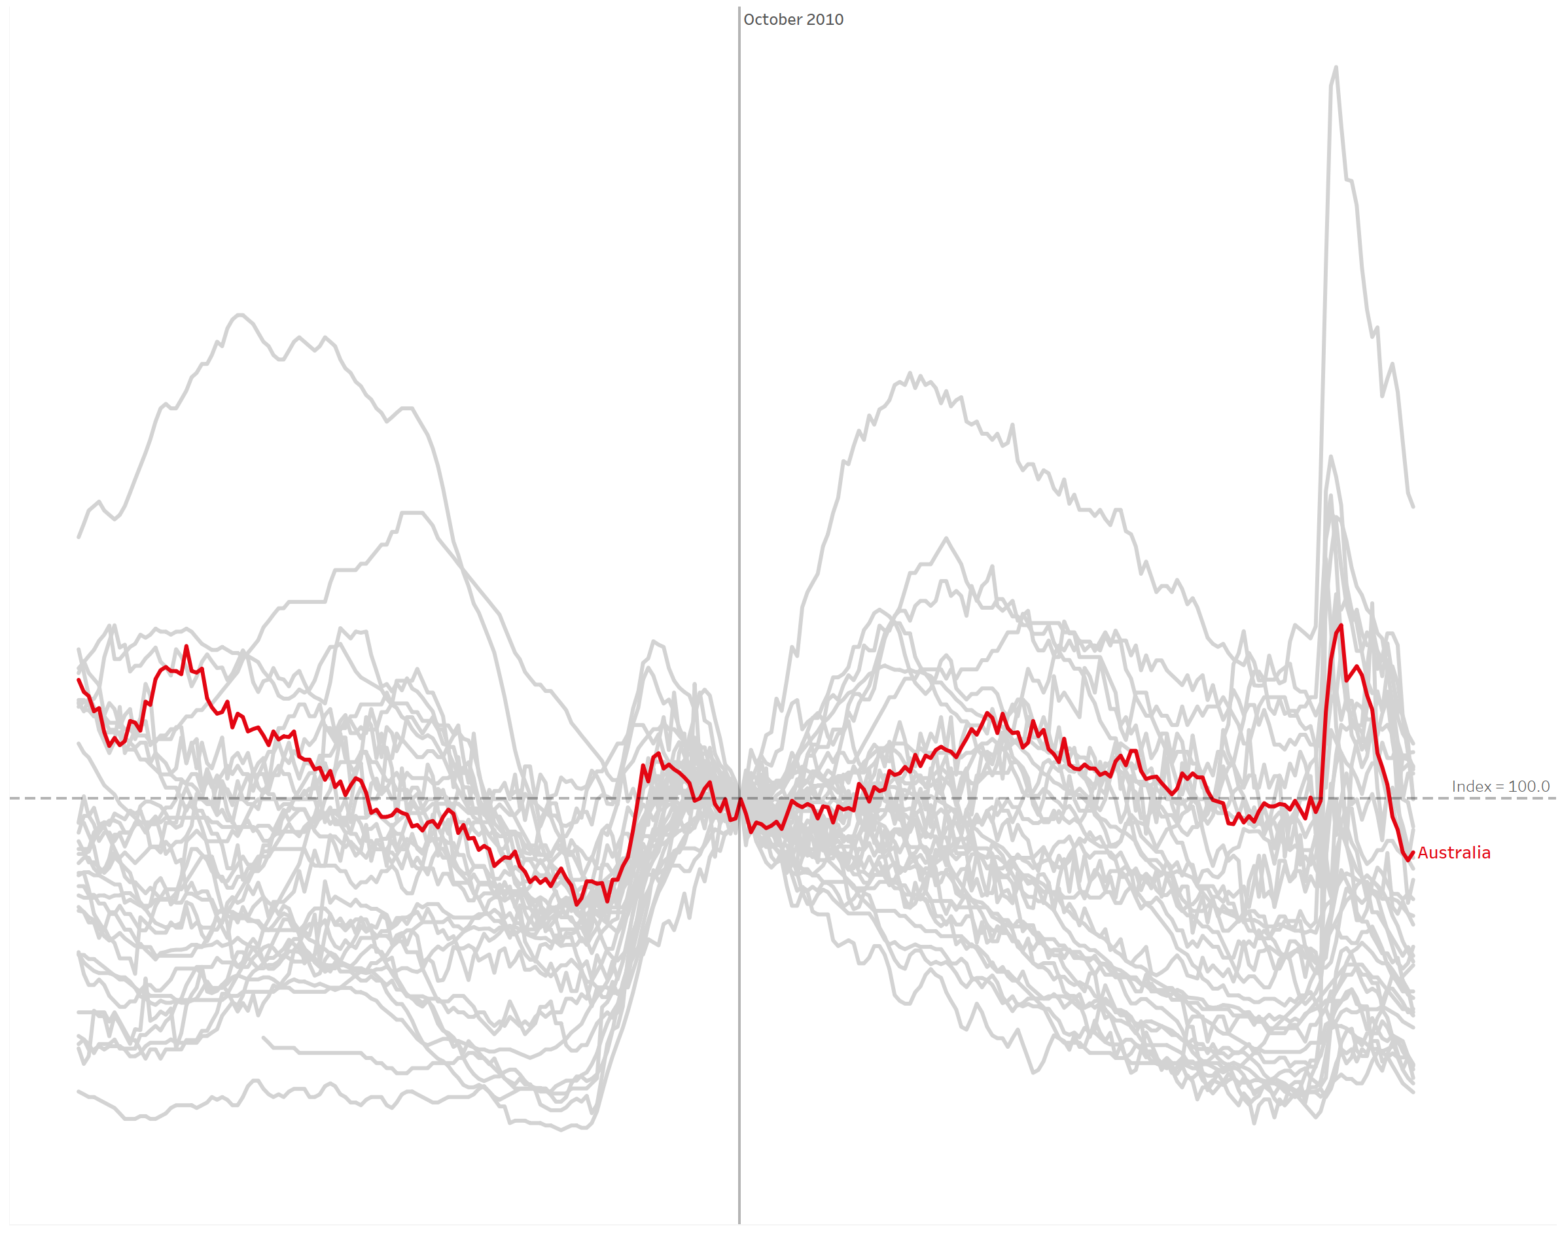
How to build and interpret an index chart using Tableau
The index chart is a chart type that often comes in extremely useful for analysing the change in time series data. You’ve probably seen these charts frequently used in finance – such as tracking a financial index like the S&P500. Here’s an example pulled from Statista looking at US Stock Indices since the start of…
-

Using a parameter to filter for specific records in a Tableau dashboard or worksheet
Filters are great and all, but I genuinely love Tableau parameters. One technique that I frequently use for certain dashboard designs is using a parameter as the primary method of interaction. That is, I use parameters to take input from users, which primarily drives the data viewed on screen. The parameter filters worksheets and shows…