Tag: visualiastion
-
It’s all about the bike: First Tableau #IronQuest submission
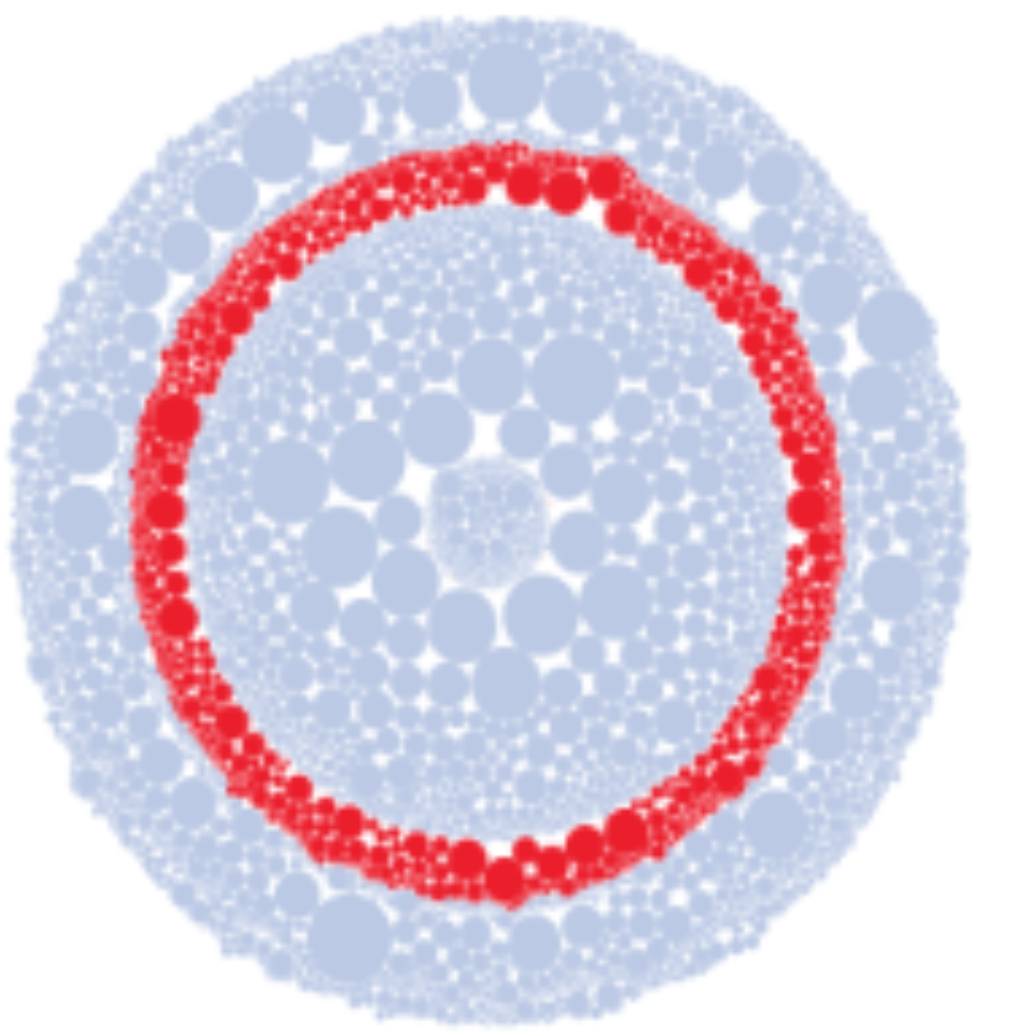
COVID-19 induced isolation has been good to me in terms of getting time to do some Tableau work. I had my heart set on completing my first ever Iron Quest submission. This months theme was the “Quantified Self”. As soon as I read about the theme, I immediately knew what I wanted to visualise: the…
