Tag: Stats
-

The importance of exploratory data analysis: Exploring the first B2VB challenge
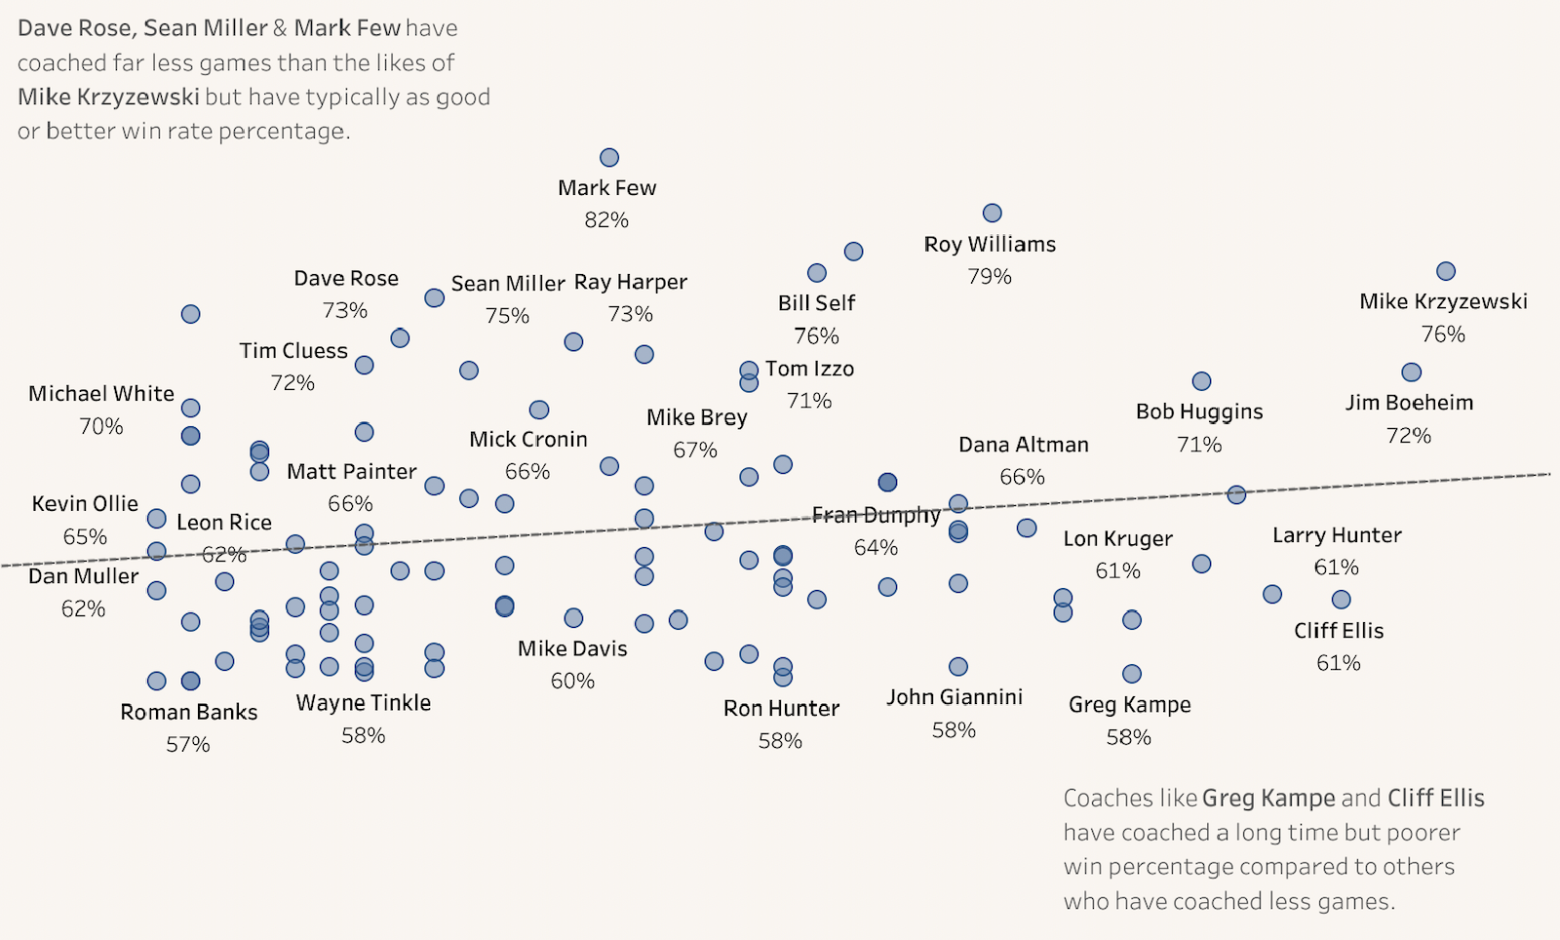
I kicked off the year participating in a brand-new data visualisation curated by Eric Balash. It’s called ‘Back to Viz Basics’, also known by its hashtag #B2VB. It’s a fortnightly challenge where the data visualisation community – both new and old – come together to practice some core charting skills. You can read about the initiative…
