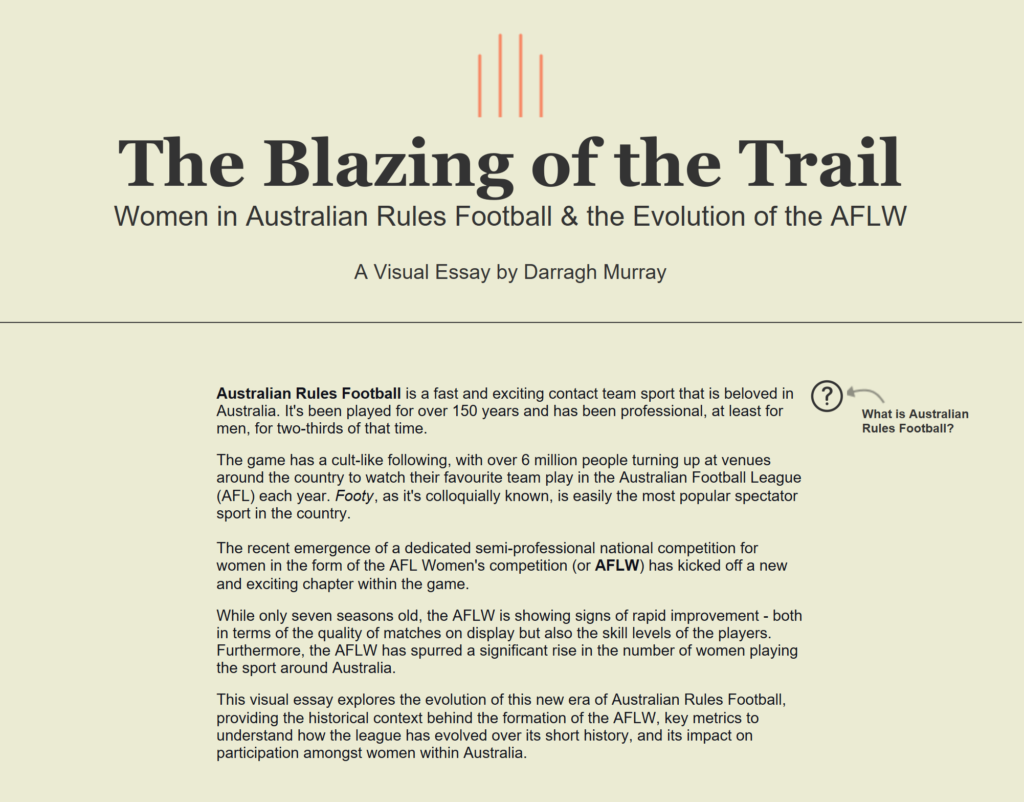
My first participation in Iron Viz Qualifier was a surreal experience.
As I hit the submit button with 10 minutes left until the submission deadline, I felt both wrung out and exhilarated. Like someone had squeezed champagne out of a tea towel. Bizarre metaphors aside, Iron Viz was an odyssey but still an overwhelmingly positive experience.
If you’re unfamiliar with Iron Viz, it’s an annual data visualisation competition built around the Tableau Public platform. Participants worldwide have a month to create and submit work on a selected theme during qualifier rounds, hoping their submission is good enough to qualify them for the grand final held at the Tableau Conference each year. Three lucky data wizards face off for the title of Iron Viz champion in front of a live audience. Being crowned Iron Viz champion is a prestigious honour, particularly amongst those who use and love Tableau.
Even though I’ve used Tableau for years, I’d never been able to get something over the line in the Iron Viz qualifiers. Strangely, now with a newborn in tow, I managed to carve out some time over October to finish the work. This year the feeder theme was ‘games’, and participants could interpret this topic widely. Fortunately, the scope also included sports.
The theme was primarily the reason that I knew I would be able to get something done. I immediately knew what I wanted to tell a story about, specifically a deep dive into the history of women in Australian Rules Football and the evolution of the AFLW, the semi-professional, national league dedicated to women’s Australian Rules Football.
Not only was this topic something I had been considering exploring for quite some time, I knew I could source high-quality, publicly accessible data quickly and get started immediately.
One Hectic Month
Despite having the topic and data sorted, my progress throughout October felt slow. I naively thought having an idea and data to work with would force the story to flow to me – but that wasn’t the case.
I got bogged down in particular design aspects and frequently changed my mind about certain things. Teasing out the narrative was also a bit tougher than I imagined. Coupled with a busy job, juggling the responsibilities of a 9-month-old and getting COVID-19 for the first time in the days before submissions – I was pretty stressed out by the end.
I almost gave in when I saw Lindsay Betzendahl submit her stunning Wordle viz a week before the deadline, and I thought I would need more time than what was available to get what I had over the line.
But after some encouraging words from colleagues and kind souls within the global Tableau #datafam and a not insignificant amount of caffeine and paracetamol (for the COVID-19), I pressed on – and managed to submit something that I was proud of with about 15 minutes to spare until deadline!
The result? An 8,500-pixel exploration of the history of women in Australian Rules Football, with a particular focus on the emergence of the semi-professional AFLW competition.

You can view my submission by clicking on this link.
An Important Story To Tell
Women in Australian Rules Football is a niche topic in the grand scheme of things. Firstly, the sport of Australian Rules Football is only very well-known in Australia (it deserves to be because it’s fantastic). Secondly, women’s participation in Aussie Rules has a relatively lower profile.
But it’s an important story to tell, considering how a women’s league’s development seems to revolutionise women’s sports in Australia. I fully expect the AFLW to eventually be one of the first full-time professional team sports in the country at some shortly.
AFLW is a sport I love watching, and this visualisation is my little tribute to women’s footy. Hopefully, my Iron Viz submission can increase its profile within Australia and globally.
Quick Fire Reflections on Iron Viz
I wanted to finish this haphazard and self-indulgent blog post with some lessons learned and advice to myself (for next year) and others who might have a shot at Iron Viz.
So without further ado, here are three lessons from traversing the Iron Viz gauntlet this year.
1. Being decisive in topic selection and data gathering is a massive time-saving strategy.
There is a popular rule of thumb about data preparation – it’s likely the most time-consuming task an analyst can engage with when building a data product (such as an Iron Viz submission).
Therefore, if you can minimise this aspect of the process, you’ll likely be able to maximize your time to work on the visible end product – the charts you construct and the narrative you weave.
A month seems like a long time, but given the level of ability on display and the inevitable roadblocks you’ll encounter, your Iron Viz build will quickly consume a lot of free time. Being decisive in choosing a topic and data set will likely set you up early for success.
I was fortunate that I had been thinking about my topic for quite some time before Tableau announced the qualifier topic. When the stars aligned on the specified theme, I immediately knew where to source the data and could immediately get started on the design and storytelling process.
I intend for future entries to be even more strategic. By building a comprehensive list of exciting topics, datasets and relevant themes, I could be ready to go from day 1 for any future Iron Viz feeder round.
So my first tip is to act decisively early and benefit hugely by the end.
2. Engage the community for critical feedback.
The online data community is the most valuable asset you can tap into during the Iron Viz feeders – particularly the Tableau community. Not only will it help you focus your ideas and approach, but it will also help you pick up errors, issues or even more ideas that you might have missed.
During the Iron Viz process, you’ll likely be deeply entrenched in the data and the story you’re trying to tell. Being so close to a topic can often be a bit blinding. There is a reason that academic work goes through long review processes before submission. It’s e valuable to get fresh eyes and perspectives on your work.
And during Iron Viz season, there are many data professionals out there who will be more than willing to provide constructive criticism. For example, Sarah Bartlett’s Iron Viz Feedback Initiative was hugely beneficial for me in preparing my submission.
I was very fortunate to have a few community superstars provide me with critical feedback along the journey. They gave up their own time to review my work, and their commentary helped me focus my thoughts, get me to critically reflect on design choices, and also make minor tweaks that inevitably made my submission better.
For example, my community advisors suggested subtle colour changes to aid accessibility, tweaks to language and terminology to make the story more inclusive and also got me to rethink chart choices to make sure I was choosing the appropriate method for communicating insight.
Given that these living legends of the data visualisation community are more than happy to provide feedback for free, you’re doing yourself a massive disservice if you don’t take them up on their offer to review your work.
And on this point, I want to personally thank CJ Mayes, Kimly Scott and Michelle Frayman for providing me with advice and feedback on my submission. Also, I want to give Sarah Bartlett a quick shout-out to Sarah Bartlett for organising the invaluable Iron Viz feedback sessions that helped so many people.
3. Accept that it will be demanding but ultimately rewarding.
There is no doubt the Iron Viz feeder process is challenging. The skill level on display seems to have increased exponentially in recent years, and one must bring their A-game if they want to have any chance of making it through.
But even if you don’t make it through, or you don’t submit or don’t feel fully satisfied with what you produce in the end, the process itself is still valuable.
Many times during this month-long visualisation marathon, I thought about quitting. It was demanding so much of me that I wasn’t sure it was worth it.
But now, after I scrambled and got something in, I understand it was worth it.
I learned more about using Tableau in one month than at any other stage. I delved deep into drawing new chart types, built complex radial gantt charts, and got super psyched when the magic and mystery of map layers began to make sense to me.
I also learned deeply about the subject matter of my visualisation. I have an excellent working knowledge of the history of women’s participation in Australian rules, and I’ve got a good idea about how to analyse AFLW players and team statistics. Iron Viz has helped me think deeper about the game I love, and regardless of the outcomes of Iron Viz, this will pay off in spades in the future.
I wouldn’t have learned this all without Iron Viz, and for that, I’m grateful. And even if I hadn’t managed to submit it on time, I still would have been thrilled with the amount of learning I got done during the feeder round.
So I’d encourage you all to give it a shot next time, and know that you’ll probably significantly advance your skills and knowledge quickly.
Thanks for reading
Congratulations if you read this far. When I started, I intended to refrain from posting a 2,000-word essay on my Iron Viz submission, but here we are. I just wanted to get some of these reflections out while they were fresh in my mind.
I wanted to say a few more “thank yous”. I was also fortunate that many in the AFL data community had done much hard work making the core statistical data readily available for anyone to scour and analyse.
I want to raise a glass to James Day and his fabulous Fitzroy API, which provides AFLW statistics in a convenient format. But a few others pointed me quickly in the right direction when I needed to get data on participation rates and so forth.
While I’ve already said a lot of thanks to individuals within the Tableau community, I wanted to restate my appreciation for everyone out there giving feedback to folks trying to get their submissions done in time. The support participants receive during the feeder rounds is fantastic. I see you.
Finally, though they don’t know it, my partner and my little boy likely got less attention from me during October. I want to thank them for their ongoing support. I couldn’t have done it if I hadn’t managed to get a few hours here and there after the baby went to bed.
Feel free to drop me a line on Twitter (@dbfmurray) if you want to chat Iron Viz or anything, but until next time, have a great one!

Leave a Reply
You must be logged in to post a comment.